Data-driven stylistic analysis of Charlie Parker solos
13 Apr 2019A quick exploration of the music21 toolkit for computational musicology using Charlie Parker’s solos, as transcribed in this MusicXML version of the venerable Omnibook.
No big findings here, just fooling around with the awesome music21 library. If you are interested in serious computational and statistical analysis of jazz solos, head over to the Jazzomat Project
import glob
import music21
import pandas as pd
import functools
import altair as alt
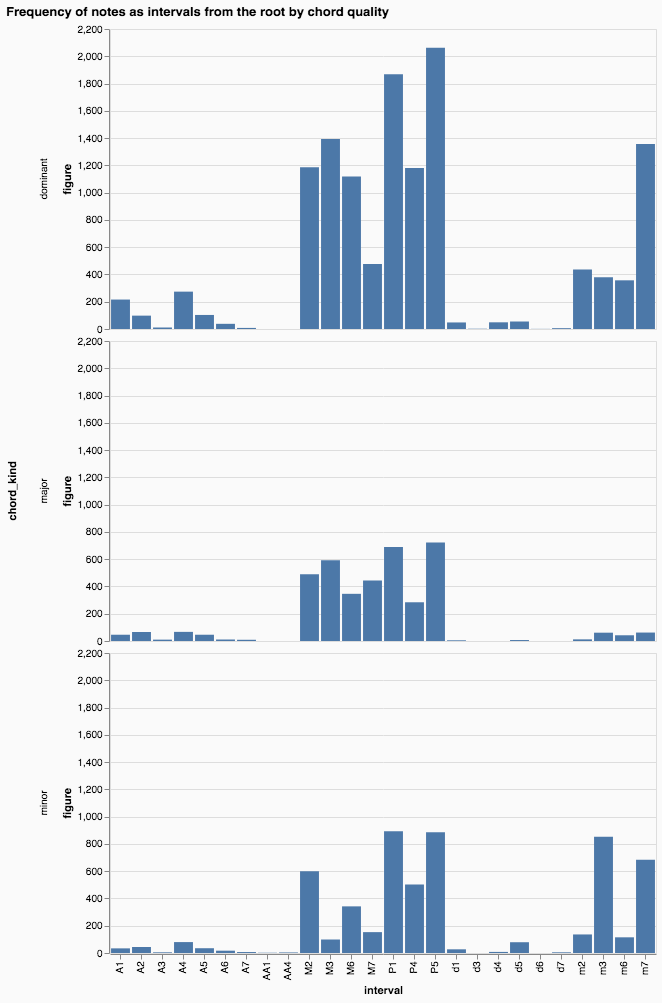
Distribution of notes (expressed as intervals from the chord root) by chord quality
What intervals from the chord root does Bird usually play, depending on the chord’s quality?
@functools.lru_cache(maxsize=4096)
def isChordTone(chord, tone_name):
    """ True if note """
    return tone_name in [p.name for p in chord.pitches]

notes = []
for fname in glob.glob('Omnibook/MusicXml/*.xml'):
    piece = music21.converter.parse(fname)
    for m in [m for m in piece.parts[0] if type(m) == music21.stream.Measure]:
        currentChord = None
        currentChordOffset = None
        for thing in m.notesAndRests:
            if type(thing) == music21.harmony.ChordSymbol:
                currentChord = thing
                currentChordOffset = thing.offset
            elif type(thing) == music21.note.Note:
                if currentChord is None:
                    continue
                interval = music21.interval.Interval(thing.pitch, currentChord.root())
                notes.append({
                    'score': fname,
                    'measure': m.measureNumber,
                    'offset': thing.offset,
                    'chord_kind': currentChord.chordKind,
                    'figure': currentChord.figure,
                    'note': thing.name,
                    'interval': interval.simpleName,
                    'interval_semitones': interval.chromatic.mod12,
                    'is_chord_tone': isChordTone(currentChord, thing.name)
                })

notes = pd.DataFrame(notes)
data = notes.groupby(['chord_kind', 'interval']).count().reset_index()
alt.Chart(data[data.chord_kind.isin(['dominant', 'major', 'minor'])]).mark_bar().encode(
    x='interval:N',
    y='figure:Q',
    row='chord_kind'
).configure(background='#fafafa') \
.properties(title="Frequency of notes as intervals from the root by chord quality")